 EN — English
 TR — Türkçe
 DE — Deutsch
 RU — Русский
 FR — Français
 ES — Español
 AR — العربية
 SR — Српски
Investment and Cost



Investment and cost: the numbers that decide the project
No crushing and screening investment is settled by a single machine price. What decides the case is not the amount invested but how many years it takes to come back, at what capacity utilisation, and at what unit cost. So the useful question is never "what does a plant cost" but "what will my cost per ton be, and where does that sit against my selling price". The articles gathered here build the budget line by line, estimate the annual spend, and then test the whole thing against financial criteria.
Everything below is symbolic. You fill the variables from your own quotations and market data: C = total investment, G = annual cash operating spend, T = saleable tons per year, p = average selling price per ton, m = cash cost per ton, K = capacity utilisation, N = economic life, r = discount rate. Absolute prices move with region, currency and power tariffs, so none are quoted here; what is given is the part that does not move — the calculation skeleton.
CAPEX: the one-off investment lines
Equipment set and ancillaries
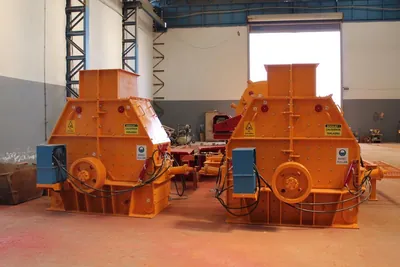
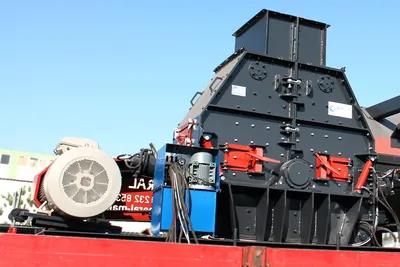
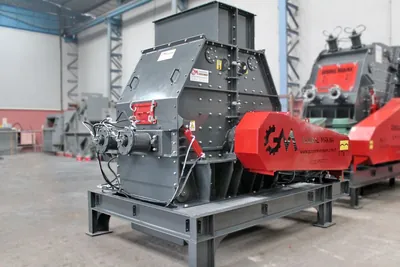
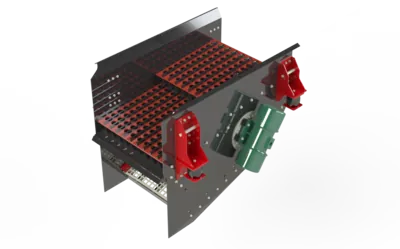
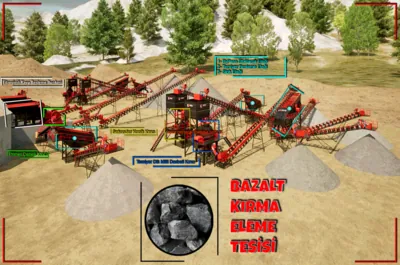
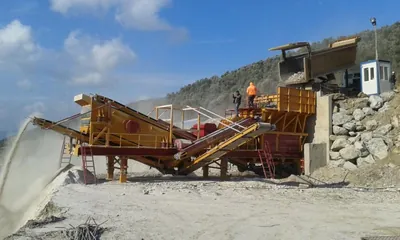
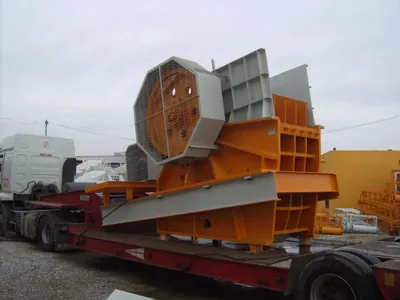
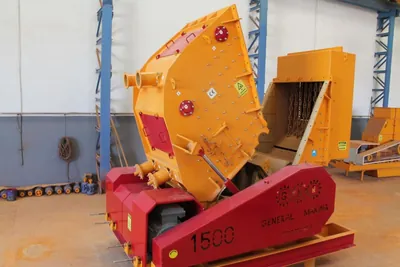
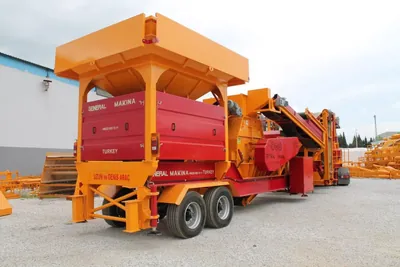
The equipment set is the most visible part of the budget and, on its own, the least sufficient. A set covers feeder, primary crusher, secondary and tertiary stages, screens, belt conveyors, bins and, where required, a washing group. Two flowsheets delivering the same tonnage can need a different machine count and a very different metre of conveyor, which separates their totals sharply. Narrowing the set through the product selection wizard fixes the technical frame before any budgeting starts. A stationary crushing plant is the starting point for a single long-life site, while the mobile crushing plant family answers relocation-driven work.
Site, foundation and power infrastructure
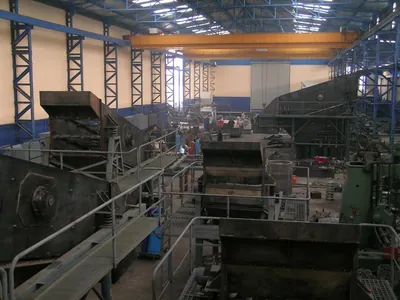
For a fixed installation, concrete foundations, mounting platforms, retaining and stockpile arrangement, drainage and haul roads form their own heading. On the power side you budget transformer, main panel, cabling and, where the grid is absent, a generator — which lands in CAPEX and then enlarges OPEX through fuel. An automation and control system holds a modest share of this heading yet carries weight far beyond that share in the payback calculation, because it moves both downtime and manning.
Permits, licences and guarantees
Licence fees, environmental assessment, operating permit, guarantees and consultancy make up the most frequently omitted heading. Its real risk is duration rather than amount: any slip in the permit calendar postpones the start of production and shifts the payback year directly. Feasibility work should carry the expected permit duration, not the optimistic one.
Logistics, erection and commissioning
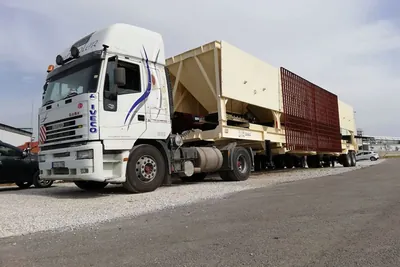
Freight, customs and insurance; crane time and erection labour; electrical connection, no-load and loaded trials and operator training all sit here. A fixed plant pays this once. A configuration that travels between sites regenerates it at every move, turning a capital line into a recurring annual cost. That single distinction is the financial core of the mobile, tracked and fixed plant decision.
OPEX: the annual operating budget
The annual budget is built from six headings: power, wear parts, oil and filters, labour, insurance-tax-overhead, and the production loss caused by unplanned stoppage. Every one of them can be divided by tonnage, and the moment it is divided it becomes comparable. Spare part stocking policy is itself a cost item: a critical part missing on site generates a downtime cost larger than the part. Lead time on crusher spare parts is therefore a financial parameter, not merely a technical one.
Calculation base for each investment and operating line
| Line item | Type | Calculation base | Most sensitive to |
|---|---|---|---|
| Equipment set | CAPEX | Machine and conveyor count in the flowsheet | Capacity and number of stages |
| Foundations and site | CAPEX | m³ concrete, m² platform | Ground bearing capacity, topography |
| Power infrastructure | CAPEX | Installed power (kW), transformer rating | Distance to grid |
| Permits and guarantees | CAPEX | Fee schedule plus consultancy | Approval calendar |
| Freight and erection | CAPEX (recurring if mobile) | Trips, crane-days | Relocation frequency |
| Power | OPEX | kWh per ton × annual tons | Tariff, idle running share |
| Wear parts | OPEX | Cost per part life in tons | Hardness, abrasiveness |
| Oil, filters, maintenance labour | OPEX | Operating hours | Maintenance discipline |
| Labour | OPEX | Shifts × crew size | Automation level |
| Downtime loss | OPEX | Stop hours × hourly contribution | Spare part availability |
| Depreciation | Non-cash | C / N | Economic life assumption |
Building the cost per ton
Cash cost per ton is m = G / T. The trap sits in the denominator: T is not catalogue hourly capacity but realised saleable tonnage for the year. Build it as T = hourly capacity × daily hours × working days × K, where K already contains maintenance stops, feed interruptions, weather and demand swings. When utilisation falls, the fixed-behaving lines — labour, insurance, depreciation — stay the same while being spread over fewer tons, so unit cost climbs. This is the sharpest lever in the whole case. Saleable tonnage is also not produced tonnage: a fraction with no demand sits in stock and pushes its cost onto the fractions that do sell. To test the effect line by line, run scenarios in the operating cost calculator.
How capacity sizing sets investment size
Capacity is the strongest single driver of investment, but the relationship is not linear. As capacity grows, unit cost falls through scale, while tied-up capital and installed power grow. Capacity below demand loses market; capacity far above demand produces low K and a high unit cost. The figures below are real specification data showing how installed power and feed opening grow alongside the capacity step. For a step-by-step comparison see 640-800-950 capacity selection.
| Model | Maximum feed size | Capacity | Optional generator |
|---|---|---|---|
| General 640 | 500 mm | 40-70 t/h | 300 kVA |
| General 800 | 600 mm | 80-120 t/h | 450 kVA |
| General 950 | 800 mm | 120-180 t/h | 600 kVA |
The generator ratings are optional and simply indicate the order of magnitude of installed power; that magnitude is the starting point when you estimate how much of the power bill lands on each ton.
The total cost of ownership window
Total cost of ownership places the purchase price inside lifetime spend: acquisition, operating cost, maintenance and repair, the production loss of downtime and disposal cost are added together, then residual or resale value at end of life is subtracted. On heavy-duty equipment the purchase price is a small part of lifetime cost, which is why a discount won at the quotation stage is easily handed back by a configuration with short wear-part life or poor energy efficiency. Opening the window across the economic life makes the inverse relationship between purchase price and lifetime cost visible. The secondary stage shows this most clearly; the cone versus impact secondary comparison sets out two different wear profiles at the same throughput.
Payback, net present value and internal rate of return
Annual cash contribution is F = T × (p − m). Simple payback is C / F; it ignores the time value of money and belongs at the screening stage only. In discounted payback each year is brought back with F / (1 + r)^t and accumulated until it equals the investment; because discounting shrinks later years, this figure is always longer than simple payback. Net present value is the sum of discounted inflows less the investment, and a positive result means the project creates value. Internal rate of return is the discount rate that drives net present value to zero, expressing the project as an annual percentage return. Use them in order: screen with payback, decide with net present value, compare against alternative uses of capital with internal rate of return. Sensitivity work should flex at least three variables — utilisation, selling price and power tariff.
Financing structures
Buying outright front-loads the cash outflow and lengthens the payback year, but carries no financing charge. Leasing matches payments to the cash the equipment generates and protects working capital; to compare it fairly, discount the lease stream and set it against the outright price. In export transactions, letters of credit and deferred terms tie the delivery calendar to the financial calendar. Whichever structure is chosen, budget the transition period between erection and steady production separately: it produces expense without producing collections.
Sections of a usable feasibility study
A feasibility study that survives scrutiny has six sections: raw material and reserve analysis, product and market analysis, technical solution and flowsheet, investment and operating budget, financial projection with sensitivity, and a risk-and-mitigation table. In the market section, haul radius governs everything, because aggregate price is highly sensitive to transport distance — the market is a geographically bounded one. The application also reshapes the case: a quarry stationary plant suits one long-life site, while recycling and road works sit on shifting ones.
Final check before committing
Before closing the budget, put four things in writing: your capacity utilisation assumption, your demand split by fraction, your wear-part consumption estimate and your permit calendar. Change any of the four and the payback year changes with it; a single number produced before all four are fixed is not a basis for a decision. If you want the line-by-line budget and the capacity scenarios worked through for your own site, send our project team your production target and material data.
Frequently Asked Questions
Which line items make up a crushing plant investment budget?
Five headings: equipment set with ancillaries, site and concrete foundations, power infrastructure, permits and guarantees, and freight with erection and commissioning. The item most often left out sits outside all five — the working capital needed between erection and the first period of steady production.
How do I calculate production cost per ton?
Divide annual cash operating spend by annual saleable tonnage. Take the denominator from realised tonnage corrected by capacity utilisation rather than from catalogue capacity; otherwise unit cost comes out systematically too low.
Which assumption most often breaks a payback calculation?
Capacity utilisation. Leave out maintenance stops, feed interruptions and demand swings and annual tonnage inflates, unit cost looks low and the payback year comes out shorter than it will be. Use the expected case for this variable, not the optimistic one.
Why does total cost of ownership matter more than purchase price?
Because on heavy-duty equipment the purchase price is a small share of lifetime cost. Power, wear parts and downtime loss repeat year after year, so a discount won at quotation is given back over the life of a plant with short part life or weak energy efficiency.
Is a mobile or a stationary configuration more profitable?
Site count and reserve life decide it. On a single long-life site the stationary configuration wins on unit cost because foundations and erection are paid once. Across several sites the mobile configuration can win despite repeated freight and set-up, because it cuts idle time between jobs.
How do I compare leasing against an outright purchase?
Discount the lease payments and compare their present value with the outright price at the same discount rate. Leasing spreads the outflow and protects working capital; buying outright avoids financing charges but front-loads cash and strains the first years of the cash balance.