EN — English
 TR — Türkçe
 DE — Deutsch
 RU — Русский
 FR — Français
 ES — Español
 AR — العربية
 SR — Српски
Screen efficiency measurement improvement from sample to setting
Why efficiency is sampled rather than judged
On site, screening performance is usually estimated by glancing at the fines visible in the oversize stream. That habit misleads, because the eye sees only part of the carryover and ignores what the feed actually contained. Proper screen efficiency measurement improvement work starts with three samples: feed, oversize and undersize. Once those three are sieved, efficiency stops being an opinion and becomes a figure that closes a mass balance.
The definition is simple. Efficiency is the proportion of undersize present in the feed that genuinely reports to the underflow. Complete separation is physically impossible, so some fines always leave with the oversize. The purpose of measuring is to make that loss visible and to identify which adjustment reduces it.
Calculating efficiency from three samples
Even with no flow meters, the undersize fraction in three samples is enough. In the example below the fraction finer than the aperture measures 0.55 in the feed, 0.12 in the oversize and 0.97 in the undersize. The mass balance returns the stream splits directly from those three numbers.
| Stream | Mass share per 100 units of feed | Undersize fraction | Undersize contained |
|---|---|---|---|
| Feed | 100.0 | 0.55 | 55.0 |
| Oversize | 49.4 | 0.12 | 5.9 |
| Undersize | 50.6 | 0.97 | 49.1 |
Undersize recovery is therefore 49.1 divided by 55.0, roughly 89 per cent. The same balance read from the coarse side shows that about 97 per cent of the oversize material in the feed reported to the overflow. Multiplying the two recoveries gives an overall figure near 86 per cent. Report both numbers rather than one headline percentage, because one describes fines loss and the other describes product contamination.
What makes the measurement valid
Samples must be taken in the same operating window, with a cut that crosses the full belt width, and repeated at least three times. If feed rate drifts during sampling, the three samples represent different regimes and the balance will not close. When mass shares come out negative or absurd, the fault lies in the sampling, not the arithmetic.
Screen efficiency measurement improvement: four reasons efficiency falls
Bed depth is the first. Too thick a layer prevents stratification, fine particles never reach the deck, and they leave with the oversize. A common rule limits bed depth at the discharge end to four times the aperture for material of roughly 1.6 tonnes per cubic metre, tightening to three times for light material near 0.8 tonnes per cubic metre. Near-size content is the second: particles close to the aperture pass slowly and blind the media. Vibration intensity is the third, since too little acceleration prevents stratification while too much makes particles bounce clear of the deck without presenting to an aperture. Media condition is the fourth, because blinding and wear reduce open area and efficiency follows it down.
Adjustment levers and target bands
Once the measurement exists, the lever to pull depends on what the data shows. The table maps symptoms onto adjustments.
| Symptom | Likely cause | Adjustment | Target range |
|---|---|---|---|
| High fines content in the oversize | Deep bed, insufficient residence time | Reduce feed rate, reduce slope | Bed up to four times aperture at discharge |
| Coarse particles in the undersize | Torn media, slack tension, aperture drift | Inspect and retension the deck | No tears, uniform tension |
| No stratification, material sliding on the surface | Acceleration too low | Increase stroke or speed | 4.0 to 4.5 g for general sizing |
| Particles bouncing, contact time too short | Acceleration too high | Reduce stroke | Typical band 3.0 to 6.0 g |
| Material not travelling on a horizontal screen | No gravity component to assist travel | Move acceleration to the upper band | 4.5 to 7.0 g on horizontal units |
| Pegging in the apertures | Excess near-size material, moisture | Change media type and aperture geometry | Clear reduction in pegged particles |
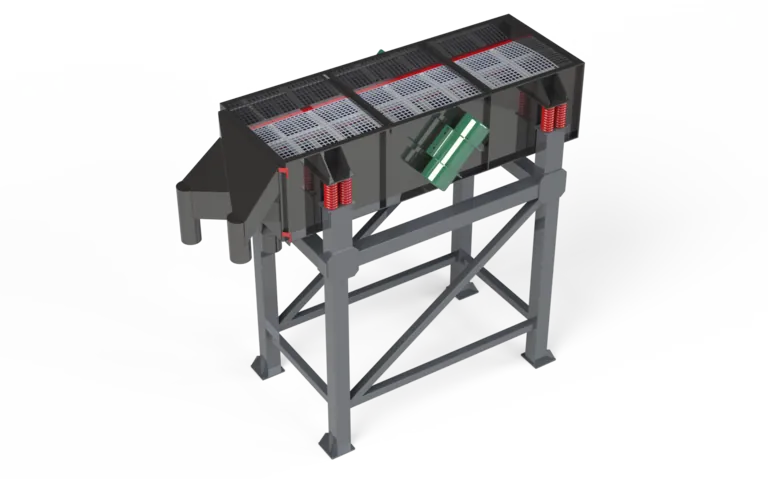
Acceleration is the product of stroke and speed and rises with the square of speed, so a small change in revolutions moves both efficiency and structural fatigue significantly. Adjust in small steps and resample after each one rather than making a single large change. Where several cuts are required, a banana screen arrangement offering more than one slope in a single body delivers longer effective screening time in the same footprint.
Making the measurement repeatable
A one off measurement supports a tuning decision but not a trend. Sampling the same three points monthly, sieved on the same series, turns efficiency into a curve that reveals media wear and feed drift early. A record sheet needs three columns: date, undersize fraction of each stream, and the two calculated recoveries. Those columns move deck replacement off the calendar and onto evidence.
Frequent questions
Is one efficiency percentage enough?
No. Undersize recovery can look healthy while coarse material contaminates the underflow. Reporting both recoveries shows immediately which product is breaching specification.
Does cutting feed rate always improve efficiency?
It improves efficiency and reduces capacity at the same time. The useful question is the highest feed rate that still meets the product specification, and that point is found only by stepping the rate and sampling at each step.
If dry screening performs poorly, is washing the answer?
If damp fines are adhering to the deck, washing makes a visible difference. If the problem is bed depth or acceleration, the cost of washing is wasted. Decide after the dry measurement, never before it.
Start with the numbers
If sieve analyses from three sampling points already exist, the efficiency calculation takes minutes. Send those results with your deck dimensions and we will return both recoveries together with a plant efficiency plan setting out which adjustment to trial and in what order.
Definitions of technical terms: Glossary