EN — English
 TR — Türkçe
 DE — Deutsch
 RU — Русский
 FR — Français
 ES — Español
 AR — العربية
 SR — Српски
Crusher plant risk assessment Fine-Kinney method
How to build a crusher plant risk assessment Fine-Kinney style
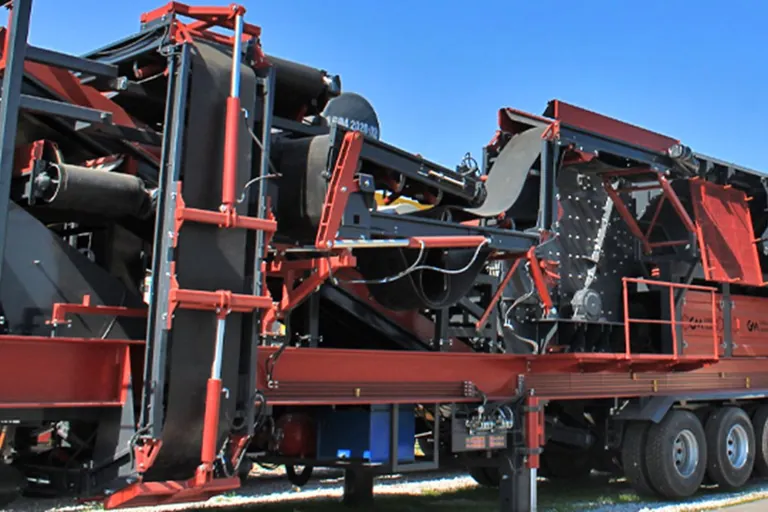
A crushing and screening plant is a workplace where hazards are not independent of each other: rotating drive components, material falling from height, heavy machine traffic, dust and noise all stack up in the same area. That stacking is what makes a list-only approach useless; the question of which hazard gets the budget first needs a numerical answer. A crusher plant risk assessment Fine-Kinney method delivers that answer as a score ranking that is hard to argue with.
The method rests on one formula: the risk score is probability multiplied by exposure and by consequence. Scoring the three variables separately carries more information than a single intuitive label of "high risk", because the same score can be reached by two different routes, and the control should attack whichever variable is inflating it.
Scales and action bands
| Variable | Score range | Typical anchors |
|---|---|---|
| Probability | 0.1 - 10 | 10 expected outcome; 6 quite possible; 3 unusual but possible; 1 remotely possible; 0.5 very unlikely |
| Exposure | 0.5 - 10 | 10 continuous through the day; 6 daily; 3 weekly; 2 monthly; 1 yearly |
| Consequence | 1 - 100 | 100 many fatalities; 40 several fatalities; 15 one fatality; 7 severe injury; 3 lasting effect; 1 first aid |
The product lands in an action band: above 400 means stop the work now, 200-400 means urgent correction, 70-200 means planned correction, 20-70 means keep it under watch, and below 20 is acceptable. An organisation may shift the band edges slightly, but the ranking logic does not change.
A plant-specific hazard inventory with scores
| Hazard | Probability | Exposure | Consequence | Score | Band |
|---|---|---|---|---|---|
| Pedestrian inside the loader manoeuvring area | 3 | 10 | 15 | 450 | Stop now |
| Inhalation exposure to respirable dust | 6 | 10 | 7 | 420 | Stop now |
| Maintenance intervention without energy isolation | 3 | 3 | 40 | 360 | Urgent correction |
| Clearing a blockage in the feed opening by hand | 6 | 3 | 15 | 270 | Urgent correction |
| Contact with a rotating pulley or drum | 3 | 6 | 15 | 270 | Urgent correction |
| Fall through a gap in the screen platform railing | 1 | 6 | 40 | 240 | Urgent correction |
| Continuous noise exposure | 6 | 10 | 3 | 180 | Planned correction |
| Load drop while lifting a wear part | 3 | 2 | 15 | 90 | Planned correction |
| Work at the electrical panel on wet ground | 1 | 3 | 15 | 45 | Watch |
The table makes two things visible. First, the hazards producing the highest scores are not rare events but ordinary situations repeated every day; once exposure reaches 10, even a low-consequence hazard climbs into the top band. Second, the hazard with the gravest outcome is not automatically the highest scoring one; intervention without energy isolation carries one of the heaviest consequence values, yet its low exposure pushes it to third place. That is precisely what allows control budget to follow real exposure rather than imagination.
Who scores it, and from what data
Scoring does not happen at one person's desk. The team needs the production supervisor, the maintenance supervisor, the safety specialist and an operator who is actually exposed to the hazard. Exposure can only be scored correctly with that last person's knowledge; a planning desk cannot know how many times someone enters a given point during a shift. Probability should draw on the plant's own records: near-miss reports, downtime logs, maintenance work orders. Where no record exists the score rests on judgement, and the assessment form should say so plainly.
Residual risk after controls
The real output of the assessment is not the first score but the score recalculated after controls. Every control must show which variable it lowers. Dust exposure shows the mechanism clearly: enclosed transfer points, water spray at the chutes and a filtered cabin bring probability from 6 down to 1, and the score falls from 420 to 70; exposure remains 10, because the worker still spends the same hours in the same area. That distinction matters, since personal protective equipment does not reduce exposure at all, only probability, and rarely suffices on its own to leave the top band.
For pedestrian and vehicle interaction the correct control attacks exposure instead. Physically separating the loader route and fencing the walkway takes exposure from continuous to weekly, and the score falls because the multiplier itself has changed. Making that separation is easier in a fixed layout than in a mobile one, because in a stationary crushing plant arrangement walkways and vehicle routes can be split at the design stage.
Keeping the form a tool rather than a document
A risk assessment form loses its value the moment it is completed and filed. Four links keep it alive. Every high-scoring row is tied to a work order carrying an owner and a date. Every near-miss report triggers a review of the probability score on the relevant row. Recurring jobs such as wear part replacement, screen media change and cleaning inside the crusher get their own permit-to-work format. And every layout change on site re-opens the exposure score of the affected rows.
When to reassess
Reassessment is not driven by the calendar alone. Rows are rescored when a new machine is commissioned, when the material type or feed size changes, after any accident or near miss, and when the shift pattern changes. These triggers belong on the first page of the form, because what has to be remembered is not the scores but the events that invalidate them. The output of the exercise sets the priorities of the wider plant occupational safety programme.
If you want the hazard inventory drawn from your own layout drawing and the scoring done together with your team, we can work through site arrangement and access routes with you.
Definitions of technical terms: Glossary