EN — English
 TR — Türkçe
 DE — Deutsch
 RU — Русский
 FR — Français
 ES — Español
 AR — العربية
 SR — Српски

Reduce Unplanned Downtime Crushing Plant
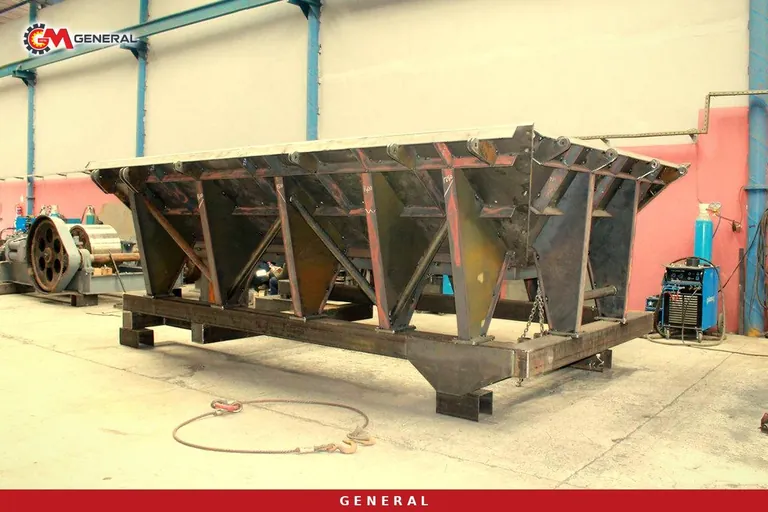
Most of the lost hours in a plant come not from the big failure everyone talks about but from the small, frequent stoppages nobody writes down. Any method to reduce unplanned downtime crushing plant operators face therefore starts not with buying equipment but with making downtime measurable. The sections below cover the logging discipline, the ranking method, the indicators to follow and the stock decision.
Fix the record first
Without a record there is no improvement. A shift downtime sheet needs at least five fields: the time the stoppage started, the time it ended, the equipment that stopped, the observed symptom and the action taken. When those five are missing, every later analysis rests on guesswork. Whether the sheet is electronic or paper matters little; what matters is that the same event is described in the same words on every shift.
The second discipline is to set no threshold. Stoppages under ten minutes are routinely skipped, yet an eight-minute blockage repeating six times in a shift means hours of lost production per month. A plant that starts logging short stoppages usually finds, in the first month, one item that changes the whole picture.
Choosing the target with Pareto
When causes are collected, a handful of them account for most of the lost hours. A Pareto ranking makes this visible: causes are sorted by total duration from largest to smallest and a cumulative percentage is added. The decision is then limited to the top two or three items; a programme that tries to solve everything at once solves nothing.
The ranking becomes more informative when run on two criteria. Sorting by total duration reveals the cause that consumes the most time; sorting by number of events reveals the cause that produces the most interruptions. These are usually not the same item, and the remedies differ: one targets repair duration, the other targets the recurrence itself.
| Indicator | Calculation | Unit | Data source | What it shows |
|---|---|---|---|---|
| MTBF | Total operating time / number of failures | hours | Shift downtime sheet | Mean time between failures |
| MTTR | Total repair time / number of repairs | hours | Work order records | Mean time to repair |
| Availability | MTBF / (MTBF + MTTR) | ratio | The two indicators above | Share of time the equipment is ready |
| Share of downtime | Cause duration / total downtime | % | Pareto table | Which cause dominates |
| Event frequency | Number of events / period | per month | Shift downtime sheet | Repeating short interruptions |
| Part lead time | Order date to delivery date | days | Purchasing record | Input to the stock decision |
Not confusing MTBF with MTTR
The two indicators describe different diseases. A low MTBF means the problem is frequency: the machine stops too often, and the root cause usually sits on the feed, material or setting side. A high MTTR means the problem is the repair: no part, no tool, poor access or no written procedure. The same number of lost hours can be reached along both paths, and the remedies are not interchangeable.
Availability combines the two and can mislead on its own. A rare but very long stoppage and a series of frequent short ones can produce a similar availability, yet their effect on the production plan is entirely different: the long one misses a delivery, the short ones quietly erode capacity.
The critical spares decision
Stocking every part ties up capital; stocking none puts production in hostage. The decision looks at three inputs: how often the part fails, how long it takes to obtain, and whether the plant stops without it. Where all three coincide, that is, a part that fails often, takes long to supply and halts the line, it is unarguably a critical spare. Where none apply, the part is managed by order.
The grey area in between is judged against the production plan. The critical list widens going into a busy season and narrows in a slow period. When setting up supply for wear and replacement items, confirming lead times on the spare parts side in advance keeps the list realistic.
Weekly rhythm and ownership
Analysis that is not attached to a short weekly meeting stays a report. The effective arrangement is this: read last week's Pareto table, assign an owner and a date to the top two items, and check whether the previous week's decisions were closed. The meeting should not run past half an hour; the moment it does, it stops producing decisions.
Ownership must not be a maintenance monopoly. A substantial share of short stoppages comes from irregular feed, material moisture or operating practice, and those items belong to production. Further reading on the subject is collected under plant efficiency.
Frequently asked questions
Should the operator keep the downtime record?
Yes, because the operator is the one who sees the event. But the sheet must be quick to fill; a fifteen-field form stays empty while a five-field form gets completed. Accuracy comes before detail.
Are predictive maintenance sensors necessary?
Vibration and temperature monitoring are valuable on specific equipment, but a sensor bought before the logging discipline exists produces data rather than decisions. The order is record first, analysis second, sensor third.
Should the target be zero downtime?
No. The realistic target is converting unplanned downtime into planned maintenance. Planned stoppage costs far less because it can be placed inside the production programme.
Collect downtime data completely for one month; the first Pareto table will tell you which investment is genuinely needed more clearly than any quotation. Talk to our service team for an assessment specific to your line.
Definitions of technical terms: Glossary