EN — English
 TR — Türkçe
 DE — Deutsch
 RU — Русский
 FR — Français
 ES — Español
 AR — العربية
 SR — Српски
Fugitive Dust Emission Measurement and Reporting
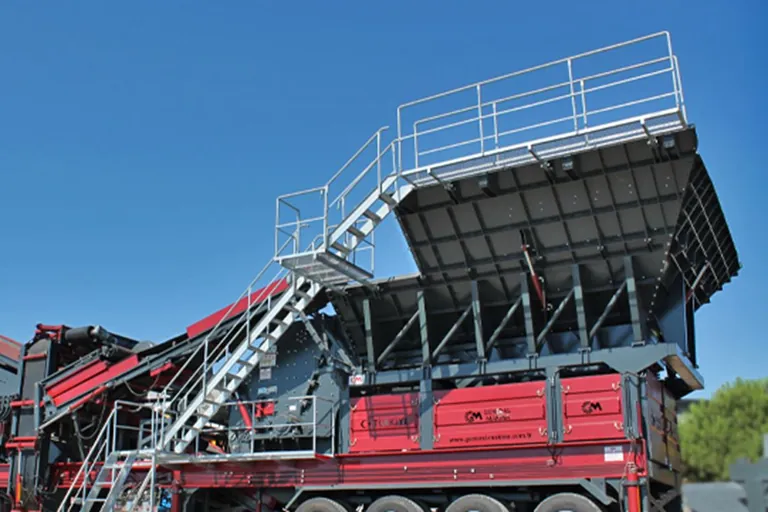
Whether a plant has solved its dust problem is settled by measurement, not by eye. Fugitive dust emission measurement and reporting covers the monitoring of sources that cannot be ducted to a stack: the crusher feed opening, transfer points, stockpiles and site haul roads. The sections below treat the methods, the siting of the measurement point and the record set requested at inspection.
How fugitive sources differ from ducted sources
At a ducted source, dust leaves through a defined cross-section at a known flow rate and measurement happens in that cross-section. At a fugitive source the release surface is undefined and the emission varies with wind, moisture and the intensity of work at that moment. What is measured at a fugitive source is therefore not the source itself but its result in the surroundings: the concentration of particles suspended in air and the quantity of dust settling on the ground.
That distinction also sets the language of the report. A report for a fugitive source does not state a mass flow leaving one stack; it states a concentration or a deposition rate measured at a given point over a given period. Where and for how long the measurement was taken matters as much as the result.
Two core methods and what each measures
Two complementary families of measurement are used on site. The first is the passive gauge that collects deposited dust; it accumulates coarse particles settling under gravity and is evaluated gravimetrically in a laboratory. The second is a gravimetric sampler that collects suspended particles on a filter and measures a defined size fraction, for example the PM10 fraction.
The two answer different questions. Deposited dust relates directly to soiling complaints from neighbouring land: it is the dust seen on roofs, vehicles and vegetation. Suspended particulate concerns exposure by inhalation. When a plant measures only one and skips the other, the missing side becomes visible immediately at inspection.
| Method | Reference | Quantity measured | Unit | Sampling period |
|---|---|---|---|---|
| Deposit gauge (Bergerhoff) | VDI 2119 | Deposition rate | mg/m² per day | 30 ± 2 days |
| Gravimetric PM10 sampler | EN 12341 | Mass concentration | µg/m³ | 24 hours nominal |
| Continuous optical dust monitor | Indicative | Short-term concentration trend | µg/m³ | Continuous |
| Meteorological record | Supporting data | Wind speed and direction | m/s and degrees | Continuous |
| Site observation sheet | Operational record | Visible dust and action taken | qualitative | Every shift |
Where the station goes
The choice of measurement point decides whether the result can be defended. Passive gauges are placed with the prevailing wind in mind: at least one upwind, in a position that gives a background value independent of the plant, and at least one downwind, between the plant and the nearest sensitive receptor. Without a background point it stays arguable whether the dust measured came from the plant or from the road.
The gauge itself follows rules: roughly one and a half to two metres above ground, with no branch or roof overhead, protected from animals and vehicles. Once chosen, the position is kept fixed; moving the point breaks the trend analysis and removes any comparison with the previous period.
Frequency, period and seasonal effect
Deposited dust monitoring runs in thirty-day periods and the result is reported as a monthly value. This prevents a single bad day from ruining the figure and equally prevents a single good day from hiding reality. PM10 measurement works on a daily basis; where it is run as a campaign, the chosen days must represent the production programme. Measuring only on low-output days makes the data useless.
The seasonal effect is written into the report. A value measured in a dry, windy period and one measured in a wet period do not describe the same operational performance. A programme running uninterrupted through the year is therefore far stronger evidence than a campaign repeated once a quarter.
The record set requested at inspection
The report alone is not enough; an inspection looks for the chain behind the number. That chain starts with the monitoring plan: coordinates of the measurement points, the reason each was chosen, the method and the frequency. Then come, for each period, the field sheet, the laboratory analysis report and the laboratory's accreditation document. Results are consolidated in a trend table and periods showing a deviation carry a corrective action record.
Equipment-side records belong to the same file: running hours of the spray system, bag filter maintenance notes, water bowser trip logs. When a result rises, these records show why. For selection criteria on the equipment itself the article on dust reduction systems offers a detailed frame; measurement sits on the other side, telling you whether that equipment is working.
Frequently asked questions
Can a continuous optical monitor replace laboratory measurement?
It cannot. An optical device is valuable for seeing a trend in real time and triggering intervention, but the reference method is gravimetric. The sound arrangement uses the optical device as an operating tool and the gravimetric measurement as evidence.
What happens when a neighbour complains?
The meteorological record, shift production data and site observation sheet for that day are read together. If the wind direction does not point at the plant, that is a defence you can show on paper; if it does, the same records reveal which control was missing that day.
Who should carry out the measurement?
Sampling and analysis are carried out by a laboratory accredited for the purpose. What stays with the operator is filling in the field sheet, protecting the integrity of the gauges and archiving the chain in full.
Design the monitoring programme while the plant is being built; measurement added afterwards cannot produce evidence for a past period. For a dust control and monitoring arrangement suited to your layout, see the other articles under environment and dust control and write to our team for detail.
Definitions of technical terms: Glossary