EN — English
 TR — Türkçe
 DE — Deutsch
 RU — Русский
 FR — Français
 ES — Español
 AR — العربية
 SR — Српски

Annual operating cost budget crushing plant teams can actually use
Why a single cost per tonne is not a budget
Ask an operation what its cost per tonne is and you usually get one number, derived by dividing last year's total spend by last year's tonnage. That figure cannot plan the coming year, because it hides which component is moving and in which direction. Building an annual operating cost budget crushing plant managers can actually use means splitting that number into components and giving each one its own measurement base: energy in kilowatt hours, wear in tonnes per part, labour in shifts.
Once the split exists, the budget stops being a list of guesses and becomes a monitoring instrument. When the total drifts during the year, the responsible line is visible immediately, and the correction lands where it belongs instead of across the board.
Energy: measurable and directly manageable
Energy is the largest or close to the largest variable cost, and it is measured in kilowatt hours per tonne. Consumption follows rock hardness and the reduction ratio demanded; the finer the product, the higher the specific energy climbs.
| Stage | Typical specific energy (kWh/t) | What drives it up |
|---|---|---|
| Jaw crusher, primary | 0.8 - 2.5 | Hard rock, coarse feed, high reduction ratio |
| Cone crusher, secondary and tertiary | 1.2 - 3.5 | Finer product target, closed circuit load |
The point of the table is not to pick a value for your plant but to test the value you measure at the meter. Ranges only tell you whether your reading is plausible. There is also a no-load burden to account for: the power consumed simply to keep a machine turning can represent between 12 and 50 per cent of rated power. Running under-loaded or with frequent start-stop cycles therefore inflates cost per tonne quickly.
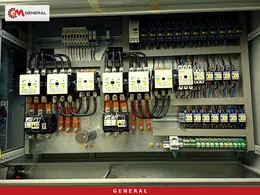
Keeping the chamber choke fed and monitoring closed side setting automatically can lower energy consumption by roughly 15 to 22 per cent. That makes energy the most concrete line on which to set a savings target, and load and speed records taken from the automation and control system show month by month whether the target is being met.
Annual operating cost budget crushing plant: budget lines and their measurement base
The table below is the skeleton of the annual budget. The share column is deliberately absent: proportions shift with rock type, plant scale and labour market, so quoting a generic percentage misleads. The sound method is to estimate each line from its own quantity and let the shares emerge afterwards.
| Budget line | Measurement base | Annual estimating input |
|---|---|---|
| Electrical energy | kWh per tonne | Measured specific consumption and annual tonnage target |
| Wear parts | Tonnes per part life | Jaw plates, mantles, concaves, blow bars, screen media |
| Lubricants and grease | Litres per operating hour | Consumption per machine and change interval |
| Planned maintenance and repair | Share of equipment cost | Common planning range of 5 to 15 per cent |
| Labour | Shifts multiplied by headcount | Operators, maintenance crew, site supervision |
| Conveyor and belt upkeep | Metres per year | Belt replacement, splices, idlers, scrapers |
| Insurance and fixed charges | Annual fixed | Policies, licence renewals, site security |
| Lost production | Hours per year | Unplanned downtime hours and hourly output value |
That last line is missing from most budgets even though it is often the largest hidden item. The value of production lost during an unplanned stop can easily exceed the price of the part that failed. An operation that does not log downtime hours cannot see that its saving on a wear part is actually generating loss.
The rock sets the wear line
Abrasiveness is the strongest driver of the wear budget. A line processing granite or basalt produces markedly higher wear cost than a line of the same scale on limestone. That is why the wear line cannot be copied from another site; you have to record your own part lives in tonnes.
Tracking deviation through the year
A budget written once in January and filed away is worthless. Three ratios are enough for monthly review: kilowatt hours per tonne, wear part consumption per tonne, and unplanned downtime hours. When one of them moves, the cause is easy to chase. Rising energy points to feed level and setting drift; rising wear points to feed gradation and part material; rising downtime points to the planned maintenance interval.
Questions from the control room
Should the budget be per tonne or annual?
Both are needed. The annual total serves cash planning, while per tonne values serve comparison and decisions. When the production target changes only the annual total should move; if the per tonne values also move, one of the assumptions is wrong.
How does generator power change the budget?
Energy produced by a generator instead of the grid costs materially more per kilowatt hour and adds a separate fuel logistics line. Where a grid connection is feasible, that difference shortens the payback on the connection investment considerably.
Does the cheapest wear part reduce the budget?
Usually not. The decision belongs on a cost per tonne basis: divide the part price by the tonnage it processes over its life. A cheap short lived part often costs more per tonne and adds downtime on top.
Build the budget on your own data
With an annual tonnage target, a rock type and current part lives, the skeleton can be filled in a single session. Send those three inputs along with your measured specific energy and downtime log, and we will prepare a line by line cost table with a monthly monitoring sheet.
Definitions of technical terms: Glossary