EN — English
 TR — Türkçe
 DE — Deutsch
 RU — Русский
 FR — Français
 ES — Español
 AR — العربية
 SR — Српски

Aggregate fraction balance stockpile planning
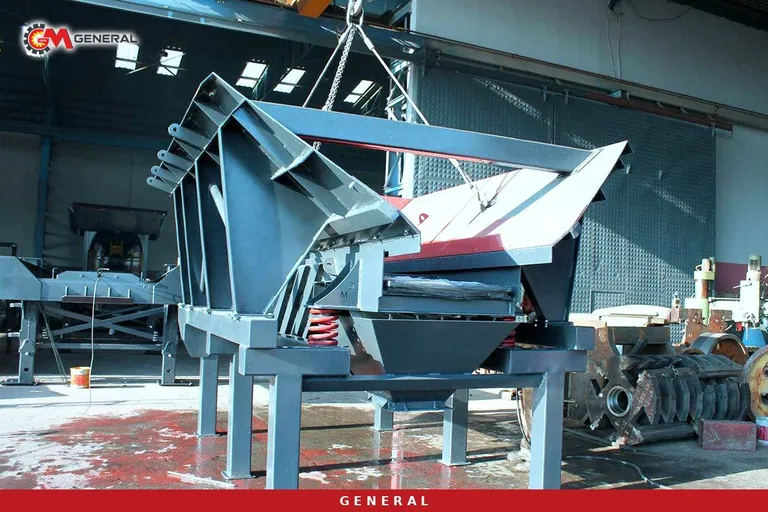
A plant hits its shift target, the crushers run loaded, the weighbridge records the tonnage; and yet the period closes with profit below expectation. The most frequent cause sits in aggregate fraction balance stockpile planning: the size distribution produced does not follow the size distribution sold, so one pile overflows while another runs out early.
Aggregate fraction balance stockpile planning: why profit falls while capacity is full
Total tonnage on its own is not a performance measure. Producing a fraction nobody buys does not return the energy, the wear parts or the yard space spent on it. Worse, the unsold pile occupies ground, generates handling cost, and risks quality degradation while it sits. Overproduction is therefore not an achievement but a waste item.
A loss runs in the opposite direction at the same time: when a fraction in demand runs out early, the sale is gone. The customer who cannot find the size places the order with another producer, and the plant loses revenue even though it filled its capacity.
Writing the demand profile fraction by fraction
The first step in planning is to write out how regional demand is distributed across sizes. That distribution changes with the customer mix and cannot be read off a total demand figure.
| Customer type | Sizes mainly wanted | Character of the demand |
|---|---|---|
| Ready-mix plant | Fine sand and medium crushed stone | Continuous, specification sensitive |
| Asphalt production | Narrow bands at defined intervals | Seasonal, tight size tolerance |
| Road sub-base | Blended and fill-type material | Project driven, uneven |
| Precast and pipe works | Washed, clean fine sizes | Low volume, high quality expectation |
| General construction and fill | Coarse sizes and pit-run blends | Price sensitive, irregular |
The table does not describe the truth of any one region; it is a frame to be filled with your own customer list. The point is to convert what the sales side reports from "so many tonnes" into "so many tonnes of that size".
Measuring the production profile and seeing the gap
The second step writes the production side the same way. The share of each size is taken from the oversize and undersize streams or from stockpile records, and placed beside the demand profile. The gap is where planning does its work.
The table below shows how that comparison is built. The figures are worked assumptions and must be replaced with your own measurement.
| Fraction | Production share (%) | Sales share (%) | Result |
|---|---|---|---|
| 0-5 mm | 34 | 22 | Overproduced, pile growing |
| 5-12 mm | 21 | 24 | Close to balance |
| 12-22 mm | 18 | 31 | Underproduced, sales lost |
| 22-40 mm | 17 | 15 | Close to balance |
| Sub-base blend | 10 | 8 | Small surplus |
In this example the circuit loses money on two lines even with capacity filled: the accumulating fine pile and the exhausted middle size. The answer is not to produce more but to shift the production profile.
The levers that shift the profile
Size distribution is not a law of nature; several levers steer it.
- Closed side setting: tightening it reduces maximum product size and can improve particle shape, but it cuts throughput and raises wear. Opening it lifts throughput while pushing the distribution coarser, which can unbalance the product mix.
- Screen aperture and deck arrangement: this is the direct lever on the target bands; a change in aperture moves both the size delivered and the circulating load.
- Bringing the tertiary stage in: where demand for fine and well-shaped material is high, the tertiary or vertical shaft stage runs harder; where demand shifts coarse, its load is reduced.
- Feed size and the quarry side: the fragmentation after blasting is the input to the circuit, and a wide gap between coarse input and fine product targets loads every stage.
The levers are used together. When the deck arrangement is changed to close a middle-size shortfall, for instance, the effect of the crusher setting on throughput has to be counted in as well. A twin vibrating screen arrangement, used to vary decks and apertures, is the component that decides how flexible narrow-band production can be.
The stockpile yard: segregation and degradation
Producing the right fraction is not enough; it has to survive in the pile. As a pile is built, particles separate by size: coarse particles carry further because of their momentum, fine particles percolate down through the voids between coarse ones, and the finest material becomes airborne and settles away from the bulk. The result is that two loader buckets from the same pile give different gradations.
The practices that reduce segregation are well known: build the pile in layers with radial and telescoping conveyors, keep freefall distance short, hold belt speed low enough not to throw the material, and keep machines off the top of the pile. When reclaiming, draw evenly from the pile face rather than only from the toe, and apply first-in first-out to older stock.
Stock policy and the weekly review
Planning is not a one-off calculation but a recurring review. A ceiling and a floor level are set for each fraction: production of a size that reaches its ceiling is throttled, and a size approaching its floor is brought forward. Three numbers are enough at the weekly meeting: pile level, tonnage sold that week, and orders waiting.
The criterion for the decision is contribution per unit of the bottleneck resource. Where crushing and screening capacity is the constraint, priority goes to the fraction that leaves the highest contribution for every hour spent at that constraint. That view is what converts capacity into profit, and it runs alongside all the measurements on the plant efficiency side.
Frequently asked questions
What can be done with overproduced fine material?
First the production profile is changed to slow the accumulation. For the existing pile, options include selling it as a blend, contributing it to a sub-base mix, or washing it into a different product; which one fits depends on the fines and clay content of the material.
How often should the balance be reviewed?
Weekly while sales are moving, monthly in quiet periods. When a new customer profile enters, the balance is rewritten straight away rather than waiting for the calendar.
Why do samples from the same pile differ?
Most likely segregation. How the pile was built, the freefall height and the reclaim method should be examined; the difference between samples is not a measurement error but the sign of a real distribution difference in the yard.
Definitions of technical terms: Glossary